Modern Journalism, Politics, and Interpretation of Science

Recently there is news about the big break through in the research on the time line of the interbreeding between humans and Neanderthals. Since I am one of the unfortunate ones that happen to get the “Neanderthal” gene leading to diabetics, I am naturally very interested in such news.

Here is the original article from National Geographic: http://news.nationalgeographic.com/news/2014/10/141022-siberian-genome-ancient-science-discovery/

Here is quote from the original text:

“Genetically, the thigh bone’s owner appears equally related to modern-day Asians and Native Americans. Surprisingly, he appears to be about as closely related to them as to the 24,000-year-old Siberian boy or Stone Age European hunter-gatherers dated in other ancient DNA studies, notes paleoanthropologist Henry Harpending of the University of Utah in Salt Lake City, who was not part of the study.

Of modern groups, the Ust’-Ishim man is less closely related to Europeans, perhaps because today’s Europeans owe some of their ancestry to farmers who migrated there from the Middle East more than 10,000 years ago.”

When Fox News retweets about the story,
http://www.foxnews.com/science/2014/10/22/neanderthals-and-humans-first-mated-50000-years-ago-dna-reveals/

This is how they put it:

“Genetic analysis of DNA from the bone revealed this man was equally closely related to present-day Asians and to early Europeans. ”

Come on–Fox, the damned stupid bone was discovered in Siberia, the other side of the Caucasus Mountains, so isn’t it natural that it is more closely related to the East Asians than modern day Europeans? Why do you have to bend science like this–out of what? Some modern day inferiority complex?

Follow up on the Blood Sugar Test Strips

LifeScan’s customer service people are very efficient–they got back to me in just one day. After checking my personal information for 7 minutes, and then asking carefully about serial no of the blood sugar monitor and lot number of test strips, the first question they asked is, “what makes you want to test your blood sugar more than once?”

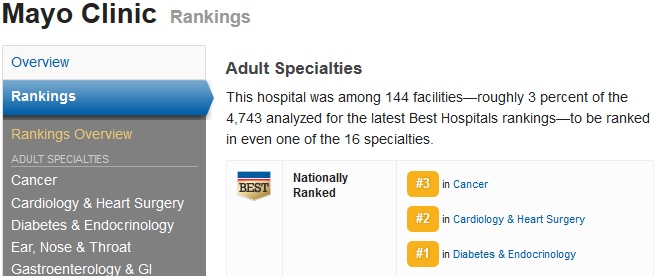
It is kind of funny, because at $1.5 per strip, I guess not many people can afford to do sanity checks like I did. Definitely not grandmas and grandpas who are on social security and medicare. And when your doctors/nurses/educators told you that you do need to test your blood sugar regularly and it is the best for you, who would doubt them? Even Mayo Clinic said so!Mayoclinic

With all the fuzz about biosensing, and all the advance in technologies, when can we have a more reliable method for testing blood? That will be a real ‘disrupting’ innovation–one that will not only destabilize a 174 Billion a year existing industry, but also benefit hundreds of millions of people around the world, including many people you know and maybe even your own grandma!

By the way, even though Mayo Clinic’s website never mentions how inaccurate these blood sugar tests are, American Association of Diabetes Educators clearly have done some research work, and here are the results they have dug up.

Here is a summary: even though that FDA only requires the glucose meters to show results within -25% to 25% of the true values for 95% of the times, most of these monitors fail to meet the standards in independent studies though they do get approved by the FDA. That means, for a person with a blood sugar of 100, it only requires the readings to be in the range of (75, 125) and they still fail it.

There is a new ISO standard coming requiring the monitors to be in the range for 99%, and FDA refuses to adopt it.


The Data Scientist’s Take on Dieting

I decided to take dieting the data science way and went out and got myself a blood sugar monitor, a One Touch Ultra Mini. Since some of my friends have been using One Touch for more than 10 years and really trust the brand, so I started to take tests without actually checking for the precision/error range of the equipment.

Definitely not the smart thing to do. In less than a week, I found something is seriously wrong with the readings I got. It started with one morning that I felt hungry only 3 hours after breakfast and decided to give my blood sugar a test.

The first number came out is 101, which was very suspicious. So my scientific training kicked in, and within 5 minutes, I took 6 readings from the tip of the same finger and got the following vastly different range of numbers:

10:52am 101
10:53am 88
10:55am 97
10:56am 96
10:57am 106
10:57am 95

The mean is 97.17, and the Standard deviation is only 5.52. Not that bad, LifeScan might argue. But the problem is that the monitor is one-reading only device. The range of the readings here is almost 18. If the number is 78, is number in the normal range as it suggested, or it could be 67 or 89? The first would mean the person is definitely going into hyperglycemia.

One the other hand, if the reading is 94, that number would mean that the person’s blood sugar is within the normal range, but adding the errors, the truth could be somewhere around 105, means he or she is definitely pre-diabetic.

By the law of large numbers, it is more likely that what I got is a normal blood sugar monitor than by the 0.1% almost negligible chance, it is a faulty one that skipped through all those supposed quality checks. So the conclusion we can draw here, is that, these blood sugar tests are extremely inaccurate.

Giving the amount of money that the health care system is spending on these test strips and monitors, I would rather say, that it is just a damn rip off by those pharmaceutical companies on the American public and the rest of the world.

Our Newest Address Parser Paper Got Accepted By GIS 2014

Last year we submitted the paper as a demo paper, and it was rejected, probably because the reviewers were confused about what the demo was about. This year we submitted it as a research paper and it got three “accept” with high confidence.

I am very excited about it! My background is in pure machine learning, conferences like ICML and NIPS were the natural venue for our papers. But when you are working for industry, it is a complete different story. The best place to publish your work depends on what the topic you are working on. Just at my current company, we have published papers at ACL, VLDB workshops, KBP, and now GIS! Talking about the broadening of one’s horizon!

Another lesson learned–sometimes if the work is more on research topics, even though we are from the industry, and our work is more about the application, it is still more appropriate to submit them to a research conference or the research track of a conference!

Address Parser and the Sexiest Profession of the 21st Century

Address Parsing is an issue of crucial importance to record linkage of people, and thus central to our business. Last Tuesday, during my boss’s presentation at the Seattle Marketing and Analytics Group meetup, a couple of data science practitioners from the retailers’ side asked us the question. Yes. We use our own address parsing software, and we have no choice but do it ourselves.

On one hand, we just have too many different data sources that we want to link and aggregate. Each has their schema and their own propensity of making errors in their addresses. We have to have something specific for each data source instead of just use the standard government issued or open source GIS address parsers to clean all of them up. On the other hand, to process the 20 plus billion records we have, pinging Google Map or Bing Map to parse the addresses is simply out of the question. Even if we can make it possible, they are still not good enough. When an ill-parsed address leads a Google Map user to the opposite side of the city, all he or she can do is giving a tirade among his family/friends on how bad Google Map is. It does not really matter to Google because nobody can really quit them. But it is not the same with us, when we get an address wrong, the angry customer will actually be on the other side of phone taking it out on our poor customer representatives, and demanding a full refund if not compensations.

But there is reason why it seems that Google Map and Bing Map have been so “deaf” to the cries of their users for improving their address accuracy. It is not they are too arrogant, address parsing is just such a hard problem. Over the years, many brilliant papers have been published in the area, promising great performance improvements. But really making these great algorithms working at an industrial scale and at a customer acceptable accuracy is not a simple task. You need to cover so many edge cases, collect so much training data and have to do so much tweaking, you have to have researchers and scientists who are not only experts at the algorithms, understanding them thoroughly and knowing how to adapt them to the problem at their hands, improving them to meet their needs, but also have the patience and dedication of sitting there through long hours of sifting through the data, cleaning them up, patching up all the edge cases, to make them work.

Unfortunately, these days, some data science practitioners understand the basics of these algorithms, use them off the shelve as if they are a black box, but never have the patience to make them really work. If one algorithm does not work, they will try another one, and if none of the off the shelves algorithms work, they will blame it on the academic and move on. They are more keen on building systems, than in actually making one simple system working elegantly and smoothly.  Some even complain that the hard work of making a machine learning based system work is just too menial and below them–they will not waste their life on them, leaving the real stake-holders (the business side), shaking their collective head, say, ‘so this is all machine learning/datamining/data science can do? It is not any better than the heuristic rule-based system that we are using.’

When I was a fresh graduate student, I asked my Ph.D. thesis adviser, Dr Thomas G Dietterich, the founding president of the International Society of Machine Learning, the secret of getting the great algorithms we were learning and developing work for real world problems. I still remember that he paused for a moment and told me, ‘the most important thing is to become a real domain expert, spending hours and hours designing and engineering your features, cleaning up your data, and tweaking the parameters. If it still does not work, write your own algorithms and beat them as hard as possible till they finally fit the shape of your problems.’

This is how we were able to build a successful record linkage system with both a high precision and recall. When I told some of my colleagues that our models usually have precision of 99.6% and recall typically in the range of 80% to 92%, most of them could not believe me. I did not lie. Nothing we used was truly magically. The only miraculous thing we did was hours and hours of feature engineering, training data cleaning, and parameter tuning.

They say that Data Science is the sexiest profession of the 21st century, but as we all know, being sexy is not that easy. It takes a lot of work, hours and hours of grueling work in the gym, all the cardio, weight lifting, squats, contouring… You have to pay meticulous details to nutrition, even to the point of being tyrannical to yourself. For us girls, we also have to spend hours and hours working on our skin, hair, make-up, clothes, …Same for the sexiest profession of the 21st century, beneath that glory outlook is hours and hours of grueling meticulous work.

Scaling For Big Graph

Scaling up for big data is hard, scaling up a big graph based clustering system is even harder, especially if you are not Google or Facebook, and don’t have an unlimited budget.

We learned the lesson the hardest way. At Inome, one of our biggest challenges is the clustering of 20+ billion records into about 250 million people profiles. We need to put the 20 billion records into a similarity graph and partition them into clusters by the values from carefully tuned and engineered machine learning based similarity models. It does not take much to describe the approach, we just have a couple of papers on it, but to build a system that implements it is no simple task.

We started from making our system work for a couple of billions of records, and scaling up a couple of billions or hundreds of millions a time, all the way to 20 billion. It has been a uphill struggle, how to optimize, best parallelize each step of the pipeline, especially the steps iterating over a large part of the graph, or synchronizing over the entire graph. Every step in the scaling up process was pure pain, sometimes we had to completely rewrite key algorithms and develop new ways to implement and improve them. That is not all. The more you parallelize the algorithm, the more stages your pipeline contains, and making the entire pipeline running robust and smoothly becomes all the more important. To do it, more stages of validation, normalization and quantative analysis on the quality of data input and output of each stage have to be added, before we finally have a robust and solid system.

It is only natural that we feel a lot of pride in pulling all of this through–the kind of joy NASA scientists and engineers experience when they watch rockets rolling off a new production line, rockets that are powerful enough to send payloads to Mars. You can imagine the shock we feel when we have to scale our system down to meet some new customer needs. We never realize how much we have done until we have to link only a couple of thousand records to our corpus. Guess you never fully appreciate how sophisticated your rocket production pipeline is unless you try to use it to make a firecracker for your daughter on the Independence day. :-)

But unlike making a firecracker, we still have 250 million profiles on the other side of the bipartite graph. To make the new scale-downed pipeline robust and working well for small data (to us, it means anywhere between thousands to tens of millions), there are still a lot of optimization to go. We have imagined during our days of struggling to scale up, that one day, after we finally make it, we might have to scale it all the way back and re-adapt ourselves to the world of “small data”.

Is MTurk for problems requiring years of training or special expertise?

We are trying to use Mechanical Turk to solve a problem that is different from most of the MTurk projects out there. First, to accomplish the task the Turker needs to have some ‘expertise’ in our subject domain. Second, we are trying to build a Machine Learning based model with very high precision requirement out of the data we collected from the Turkers. Instead of trying to find the model with the best precision/recall trade-off, we require our model to have very high precision (99.6%) and the best recall we can get for that precision level.

We are not sure yet whether MTurk is the way to go to get quality training/evaluation data. But we have been using it for almost two years. We spent a lot of money and efforts on collecting, cleaning and maintaining. So far it is somewhat meeting our expectation.

Here are some of the points:

1. Training and maintaining a population of Turkers with high accuracy:

We maintain continuous communications with the Turkers on TurkerNation. Whenever we set up a batch of HITs on MTurks, our researchers/analysts will monitor our TurkerNation board/thread to see if the Turkers have any questions about the HITs. If they do, we will try to answer the questions right away.

We salt our HITs with examples from our golden set, and use them to evaluate the Turkers.

We offer 100% bonus to Turkers who have accuracy of 100%. Most of the time none of the Turkers got 100% of the salted HITs correct. If this is the case, we always bonus the Turker with the highest accuracy by 100%. The rest of the Turkers will receive bonus based on their accuracy level. Usually we only bonus Turkers with accuracy higher than 80%, but if the batch is too hard, we may just bonus the top 20% or 30% of Turkers regardless of their precision.

After we evaluate each batch, we usually post messages about the accuracy information of each Turker and the amount of bonus they get on TurkerNation after each batch of HITs. The Turkers who read those posts can get an estimate of how well they perform compared to other Turkers.

To train the Turkers, we build and maintain a very detailed guideline page which takes some time to read, and edit it when our task changes or feedback from the Turkers suggests that we need to change and clarify our guideline. After a while, our guideline has become so long and it is very difficult for the Turkers to reference. To make it easier for the Turkers, in addition to the guideline pages, we create a set of example HITs with the correct answer and explanation. We add a link in the instruction section on our HITs, so the Turkers can go through them for reference very conveniently.

To further improve the accuracy of our Turkers, we expose a very powerful internal feature that we used in the model to the Turkers to help them make decisions for the ambiguous cases. This internal feature/score is so powerful, that some of the Turkers treat it as if it is the Golden Oracle, and are afraid of making decisions that are contradictory to the score. The pros: We did see a big increase in the accuracy of our Turkers. The cons: Sometimes the Turker just got lazy and made decisions by looking at that feature only. But most of the cases, our Turkers take our HITs very seriously and do take time working on the HITs very carefully.

2. A multiple tier labeling system

The first tier are the Turkers. Inside this tier we use a qualification score to separate them into Turkers and Super Turkers. Some of our jobs are only available to the Super Turkers. Usually we send out three types of jobs: a. Qualification jobs–these are offered to all Turkers who has an approval rate over 98%, and have done more than 500 HITs. These batches usually go parallel with our HITs for super Turkers. We use them to recruit more Super Turkers who do well on our HITs. These HITs are usually priced at 2 cent each. b. Super Turkers–these are the Turkers with qualification score over 8.  A majority of our HITs go to these Turkers. They pay 50% better than the ones for the general public at 3 cents. c. Super Super Turkers–Super Turkers who have done really well with us and with autoqual score over 25. We send some of our arbitration batches (batches of HITs that the super Turkers disagree on) to our Super Super Turkers, and pay them 5 cents for each HITs. These are only the base pay–in addition, there are always accuracy based bonuses.

The Super Turkers autoqual scores are adjusted based on their accuracy–the good ones will get an increase of 1 or 2 or even 3, and the bad ones will get an decrease of -1 or  -2. If their performance is really bad, we just disqualify them.

The second tier are our internal Data Raters. We hire people who usually have at least a bachelor degree to do the job on an hourly basis. They can work from home at any hours that are convenient to them and as many hours as they want. We bring them in for training when we see some big problems with their labeling results. The Data Raters work on two types of HITs: Hits the Super Turkers disagree on. We also put on MTurk the False Positives and False Negatives of our models and have the Data Raters work on them.

The third tier are our researchers, data analysts and QA team. These people go through the final false positives and false negatives together–usually many of these are very ambiguous cases–and discuss what the labels should be from their own perspectives. The things we learn from these sessions will become our new Label Guidelines and training examples.